
Implementing Glowroot: A Hands-On Tech Review for Application Monitoring Mastery
1. Introduction In the realms of information technology and systems management, Application Performance Management (APM) involves monitorin...
1. Introduction
In the realms of information technology and systems management, Application Performance Management (APM) involves monitoring and overseeing the performance and availability of software applications. APM aims to identify and diagnose intricate application performance issues to uphold a predefined level of service.
Glowroot is an open-source APM that facilitates a quicker resolution of application performance issues by helping us pinpoint the root causes. It supports applications running from Java 6 onwards.
2. Key Features
- Response Time Breakdown Charts: Visualizes the breakdown of response times for better analysis.
- Response Time Percentile Charts: Offers percentile charts to understand response time distribution.
- SQL Capture and Aggregation: Captures and aggregates SQL queries for in-depth analysis.
- Service Call Capture and Aggregation: Gathers and aggregates data on service calls for comprehensive insights.
- MBean Attribute Capture and Charts: Monitors and charts MBean attributes for performance evaluation.
- Configurable Alerting: Allows users to configure alerts based on specific criteria.
- Historical Rollup: Provides historical data rollup at different intervals (1m, 5m, 30m, 4h) with configurable retention settings.
- Full Support for Async Requests: Supports asynchronous requests that span multiple threads.
- Responsive UI with Mobile Support: User-friendly and responsive interface with mobile support for accessibility.
- Optional Central Collector: Offers the flexibility of an optional central collector for centralized data management.
- Supports Multiple Application Servers: Wildfly, JBoss EAP, Tomcat, TomEE, Jetty, Glassfish, Payara, WebLogic, WebSphere
3. Central Collector
3.1 Installation
  version: '3.8'

networks:
  tradewise-network:

services:
  cassandra:
    image: cassandra:latest
    container_name: cassandra
    restart: unless-stopped
    ports:
      - "9042:9042"
    networks:
      - tradewise-network

  glowroot-central:
    image: glowroot/glowroot-central:0.14.1
    container_name: glowroot-central
    restart: unless-stopped
    volumes:
      - ./glowroot-central.properties:/usr/share/glowroot-central/glowroot-central.properties
    depends_on:
      - cassandra
    ports:
      - "4000:4000"
      - "8181:8181"
    networks:
      - tradewise-network
4. Instrumentation
4.1 Editing the pom.xml File
<plugin>
	<groupId>org.apache.maven.plugins</groupId>
	<artifactId>maven-resources-plugin</artifactId>
	<executions>
		<execution>
			<id>glowroot-plugins</id>
			<phase>validate</phase>
			<goals>
				<goal>copy-resources</goal>
			</goals>
			<configuration>
				<outputDirectory>target/glowroot-plugins/</outputDirectory>
				<resources>
					<resource>
						<directory>glowroot-plugins</directory>
						<filtering>false</filtering>
					</resource>
				</resources>
			</configuration>
		</execution>
	</executions>
</plugin>

<plugin>
	<groupId>org.apache.maven.plugins</groupId>
	<artifactId>maven-dependency-plugin</artifactId>
	<version>${maven-dependency-plugin.version}</version>
	<executions>
		<execution>
			<id>copy-glowroot-jar</id>
			<phase>prepare-package</phase>
			<goals>
				<goal>copy</goal>
			</goals>
		</execution>
	</executions>
	<configuration>
		<artifactItems>
			<artifactItem>
				<groupId>org.glowroot</groupId>
				<artifactId>glowroot-agent</artifactId>
				<version>${glowroot-agent.version}</version>
				<type>jar</type>
				<overWrite>false</overWrite>
				<outputDirectory>${project.build.directory}</outputDirectory>
				<destFileName>glowroot.jar</destFileName>
			</artifactItem>
		</artifactItems>
	</configuration>
</plugin>
4.2 Preparing the Dockerfile
# Base Image
FROM eclipse-temurin:17-jdk-alpine
LABEL author=CzetsuyaTech
LABEL maintainer=CzetsuyaTech

# Configuration
WORKDIR /

RUN addgroup --system czetsuyatech && \
    adduser --system czetsuyatech --ingroup czetsuyatech && \
    mkdir -p /glowroot /glowroot/tmp /glowroot/logs /glowroot/plugins && \
    echo '{ "web": { "bindAddress": "0.0.0.0" } }' > /glowroot/admin.json && \
    chown czetsuyatech:czetsuyatech -R /glowroot && \
    chmod -R 777 /glowroot

USER czetsuyatech
ADD --chown=czetsuyatech:czetsuyatech target/glowroot.jar /glowroot
ADD --chown=czetsuyatech:czetsuyatech target/glowroot-plugins /glowroot/plugins

# Service
ADD --chown=czetsuyatech:czetsuyatech target/*.jar app.jar

# Start
ENV JAVA_JAR "/app.jar"
ENV JAVA_OTHERS "-Xshare:off"
ENV JAVA_OPTS ${JAVA_OPTS}
ENV JAVA_MEM ${JAVA_MEM}

RUN echo "exec java $JAVA_MEM $JAVA_OPTS $JAVA_OTHERS -jar $JAVA_JAR"
ENTRYPOINT exec java $JAVA_MEM $JAVA_OPTS $JAVA_OTHERS -jar $JAVA_JAR
4.3 Running the Spring Boot Service
JAVA_OPTS=-javaagent:glowroot/glowroot.jar -Dglowroot.collector.address=localhost:8181 -server -Dglowroot.agent.id=TradewiseAI
5. GUI
5.1 Usage
5.2 Transactions
5.2.1 Web
- By choosing "Response Time," we can identify which HttpRequests and JDBC Queries are taking longer in the REST Endpoints.
- Opting for "Slow Traces" allows us to pinpoint the specific endpoint that consumes more time.
- Selecting "Queries" reveals insights into the queries made, indicating that using the count query is more resource-intensive compared to the select query. This information aids in optimizing and refining the performance of REST Endpoints.
5.2.2 Background
- Choosing "Response Time" allows us to identify which Job and Hibernate Queries are consuming more time in the background processes.
- Opting for "Slow Traces" reveals that some calls take more time, providing insights into areas that may require attention.
- Selecting "Queries" and filtering by the select query, we observe that it is called more frequently and takes longer, particularly when filtered by status. This information helps in understanding and addressing potential bottlenecks in the background processes.

5.2.3 Startup
- By choosing "Response Time," we can identify which startup and filter init processes consume more time.
- Opting for "Slow Traces" reveals the duration it takes for the context to initialize fully.
- Selecting "Queries" provides insights into the database queries. Some queries will be more resource intensive, with fewer calls but longer duration. This information aids in pinpointing specific areas for optimization within the startup processes.
5.3 Errors
5.3.1 Web
- Choosing "Error Messages" reveals errors of type XXXException.
- Opting for "Error Traces" provides details on the errors.
- Clicking on a specific error allows us to view the detailed trace, aiding in the understanding and resolution of the issue.
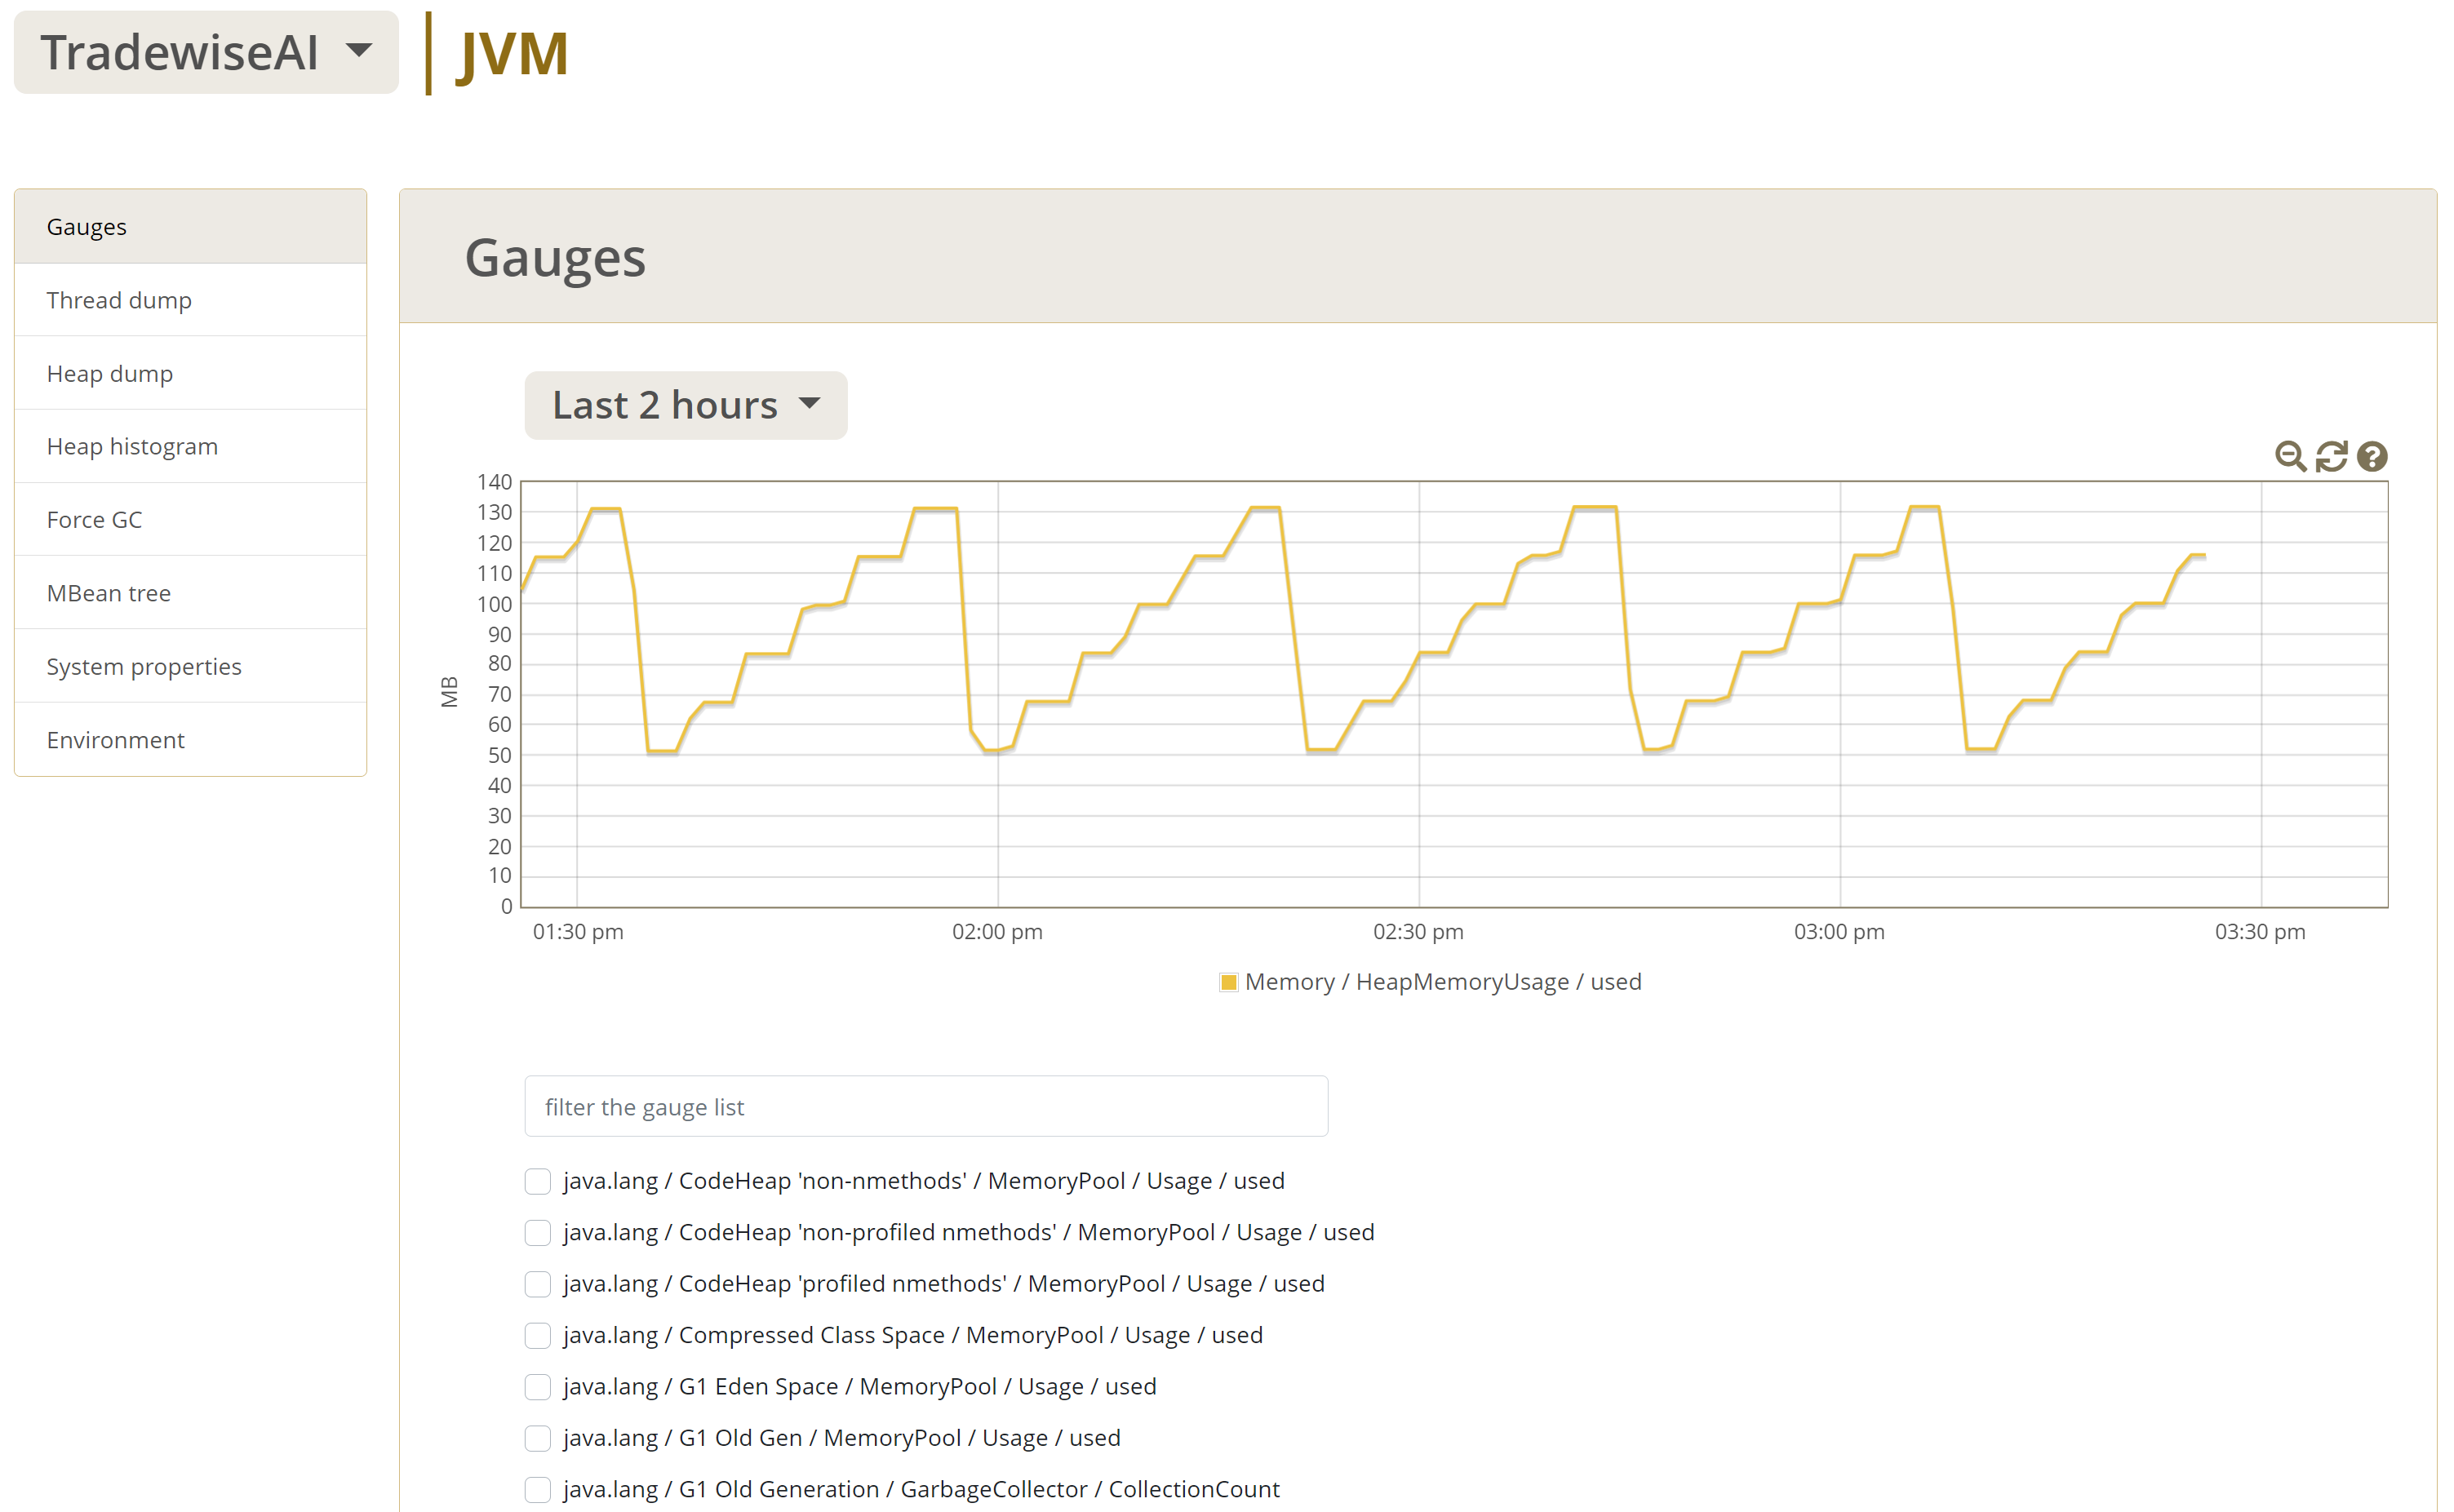
5.4 JVM
5.5 MBeanTree

6. Recommendation
In a typical product infrastructure, Glowroot serves as our APM tool in each microservice. All microservices are instrumented to gather and transmit data to Glowroot, enhancing our understanding of system behavior. We've chosen Glowroot based on various criteria, including its license-free nature, alignment with the Java ecosystem, and straightforward instrumentation for microservices, ensuring a simple ramp-up and configuration process.


Post a Comment